After logging strong returns in 2017, global equity markets delivered negative returns in US dollar terms in 2018. Common news stories in 2018 included reports on global economic growth, corporate earnings, record low unemployment in the US, the implementation of Brexit, US trade wars with China and other countries, and a flattening US Treasury yield curve. Global equity markets delivered positive returns through September, followed by a decline in the fourth quarter, resulting in a –4.4% return for the S&P 500 and –9.4% for the MSCI All Country World Index for the year.
The fourth quarter equity market decline has many investors wondering how equities may perform in the near term. Equity market declines of 10% have occurred numerous times in the past. The S&P 500 returned –13.5% in the fourth quarter while the MSCI All Country World Index returned –12.8%. After declines of 10% or more, equity returns over the subsequent 12 months have been positive 71% of the time in US markets and 72% of the time in other developed markets.[1]
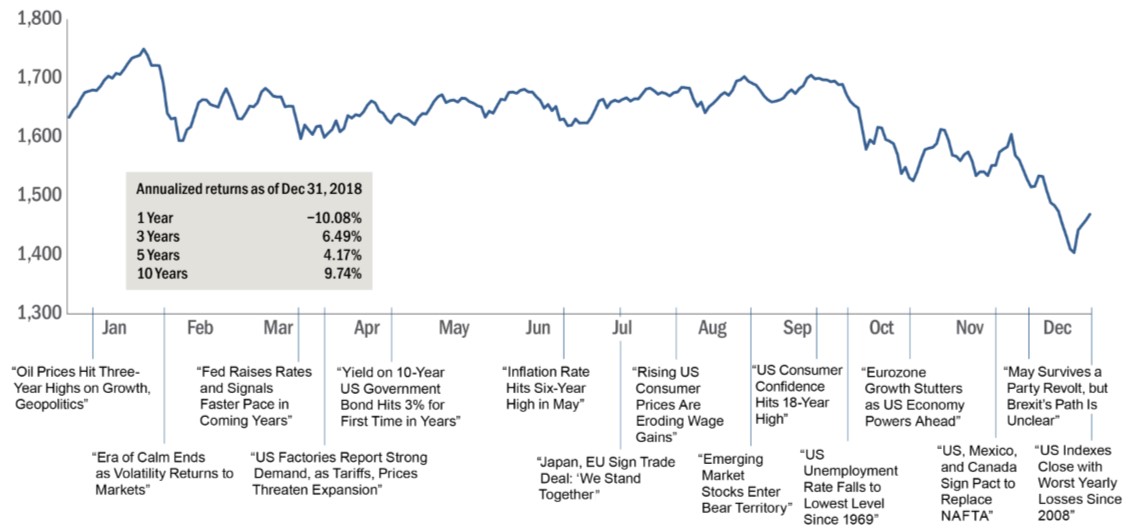
Figure 1 highlights some of the year’s prominent headlines in the context of global stock market performance as measured by the MSCI All Country World Index (IMI). These headlines are not offered to explain market returns. Instead, they serve as a reminder that investors should view daily events from a long-term perspective and avoid making investment decisions based solely on the news.
Figure 1: World Stock Market Performance (MSCI All Country World Index)
Sources: BEA, Statistics Canada, Cabinet Office (Japan), National Bureau of Statistics (China), Eurostat, Australian Bureau of Statistics, Office for National Statistics (UK)
Market Volatility
Figure 2 shows the performance of markets subsequent to declines of 10%, 20%, and 30%. For each decline threshold, returns are shown for US large cap, non-US developed markets large cap, and emerging markets large cap stocks in the following 12-month period. While declines in equity markets may cause investor concern, the data provides evidence that markets generally have positive returns after a decline.
Figure 2: Average Compound Returns for Stocks in a Following 12-Month Period
| Market Decline Cutoff | US Large Caps | Non-US Developed Markets Large Caps | Emerging Markets Large Caps |
|---|---|---|---|
| 10.00% | 11.25% | 11.18% | 13.51% |
| 20.00% | 11.61% | 14.44% | 21.52% |
| 30.00% | 14.31% | 19.07% | 30.05% |
Past performance is not a guarantee of future results. Declines are defined as points in time, measured monthly, when the market’s return since the prior market maximum has declined by at least 10%, 20%, or 30%, depending on the cutoff. Declines after December 2017 are not included, but subsequent 12-month returns can include 2018 returns. Compound returns are computed for the 12 months after each decline observed and averaged across all declines for the cutoff. US Large Cap is the S&P 500 Index, from January 1926 through December 2018, provided by Standard & Poor’s Index Services Group. Non-US Developed Markets Large Cap is the MSCI World ex USA Index (gross div.), from January 1970 through December 2018. Emerging Markets Large Cap is the MSCI Emerging Markets Index (gross div.), from January 1988 through December 2018. MSCI data © MSCI 2019, all rights reserved.
The increased market volatility in the fourth quarter of 2018 underscores the importance of following an investment approach based on diversification and discipline rather than prediction and timing. For investors to successfully predict markets, they must forecast future events more accurately than all other market participants and predict how other market participants will react to their forecasted events.
There is little evidence suggesting that either of these objectives can be accomplished on a consistent basis. Instead of attempting to outguess market prices, investors should take comfort that market prices quickly incorporate relevant information and that information will be reflected in expected returns.
World Economy
In 2018, the global economy continued to grow, with 44 of the 45 countries tracked by the Organization for Economic Cooperation and Development (OECD) on pace to expand. Argentina was the only country expected to contract.[2] While market participants may consider the economic outlook of a region, it is just one of many inputs that determine realized market performance.
Figure 3: Real GDP Growth by Region (%, annual rate)
| 2017 | 2018 | |||
|---|---|---|---|---|
| Q4 | Q1 | Q2 | Q3 | |
| United States | 2.3 | 2.2 | 4.2 | 3.4 |
| Canada | 1.7 | 1.7 | 2.9 | 2 |
| Euro Area | 2.7 | 1.5 | 1.7 | 0.6 |
| Japan | 1.5 | -1.3 | 2.8 | -2.5 |
| China | 6.1 | 6.1 | 7 | 6.6 |
| Australia | 2.2 | 4.3 | 3.6 | 1 |
| United Kingdom | 1.5 | 0.4 | 1.6 | 2.5 |
Sources: BEA, Statistics Canada, Cabinet Office (Japan), National Bureau of Statistics (China), Eurostat, Australian Bureau of Statistics, Office for National Statistics (UK)
2018 Market Perspective
Equity Market Highlights
Global equity markets, as measured by the MSCI All Country World Index, ended the year down –9.4%, with significant dispersion by country.
US equities generally outperformed other developed markets for the year, although they lagged other developed and emerging markets in the fourth quarter. The S&P 500 Index recorded a –4.4% total return for the year and –13.5% return in the fourth quarter.
Returns among other developed equity markets were negative. The MSCI World ex USA Index, which reflects non-US developed markets, was down –14.1% for the year and –12.8% for the fourth quarter, and the MSCI Emerging Markets Index fell –14.6% for the year and –7.5% for the fourth quarter. US small cap stocks, as measured by the Russell 2000 Index, returned –11.0% for the year.
Impact of Global Diversification
While markets around the world generally had negative returns in the fourth quarter, the dispersion in their returns highlights the importance of global diversification during market declines. The MSCI All Country World ex USA Index (IMI) outpaced the S&P 500 for the quarter (–11.9% vs. –13.5%). Given the strong returns of US markets through September, however, the US equity market was one of the stronger performing markets for the year, ranking seventh out of the 47 countries in the MSCI All Country World Index (IMI).
The S&P 500 Index’s –4.4% return marked the end of nine consecutive positive annual returns. Despite the negative return this year, the S&P 500 has still produced a 13.1% annualized return for the 10 years ending December 31, 2018.
When considering individual countries, 46 out of 47 countries were down for the year. Using the MSCI All Country World Index (IMI) as a proxy, no countries posted positive returns among developed markets, and only Qatar managed a positive return among emerging markets. As is typically the case, country-level returns varied significantly. In developed markets, returns ranged from –24.1% in Belgium to 0.0% in New Zealand. In emerging markets, returns ranged from –41.3% in Turkey to 27.1% in Qatar—a spread of almost 70%. Large dispersion among country returns is common, with the average spread in emerging markets over the past 20 years of 90%.[3] Without a reliable way to predict which country will deliver the highest returns, this large dispersion in returns between the best and worst performing countries again emphasizes the importance of maintaining a diversified approach when investing globally.
To emphasize this point, Israel went from being the worst performer in developed markets in 2017 (10.4%) to the second-best performer in 2018, returning –3.6%. Likewise, Qatar went from being the second worst performing emerging market country (–12.5%) in 2017 to being the best performer in 2018.
When considering investing outside the US, investors should remember that non-US stocks help provide valuable diversification benefits, and that recent performance is not a reliable indicator of future returns. It is worth noting that if we look at the past 20 years going back to 1999, US equity markets have only outperformed in 10 of those years—the same expected by chance. We can examine the potential opportunity cost associated with failing to diversify globally by reflecting on the period in global markets from 2000-2009, commonly known as the “lost decade” among US investors. While the S&P 500 recorded its worst ever 10-year cumulative total return of –9.1%, the MSCI World ex USA Index returned 17.5%, and the MSCI Emerging Markets Index returned 154.3%. In periods such as this, investors were rewarded for holding a globally diversified portfolio.
Currencies
Currency movements detracted from US dollar returns in 2018 for non-US dollar assets. The strengthening of the US dollar vs. weakening of non-US currencies had a negative impact on returns for US dollar investors with holdings in unhedged non-US dollar assets, and detracted 3.5% from the returns as measured by the difference in returns between the MSCI All Country World ex USA IMI Index in local returns vs. USD. The US dollar strengthened against most currencies, including the euro, the British pound, and the Canadian dollar, and weakened against the Japanese yen.
As with individual country returns, there is no reliable way to predict currency movements. Investors should be cautious about trying to time currencies based on the recent strong or weak performance of the US dollar or any other currency.
Figure 4: Major World Indices (as of 12/31/2018)
| Index | Q4 2018 | One Year | Three Years* | Ten Years* |
|---|---|---|---|---|
| US Equity Returns | ||||
| Russell 3000 | -14.3 | -5.29 | 9.0 | 13.2 |
| Russell 2500 | -18.5 | -10.0 | 7.3 | 13.2 |
| Russell 2000 | -20.2 | -11.0 | 7.4 | 12.0 |
| Russell 1000 | -13.8 | -4.8 | 9.1 | 13.3 |
| S&P 500 | -13.5 | -4.4 | 9.3 | 13.1 |
| Russell 3000 Value | -12.2 | -8.6 | 7.0 | 11.1 |
| Russell 3000 Growth | -16.3 | -2.1 | 10.9 | 15.2 |
| Non-US Equity Returns (net div.) | ||||
| MSCI All Country World | -12.8 | -9.4 | 6.6 | 9.5 |
| MSCI All Country World ex USA | -11.5 | -14.2 | 4.5 | 6.6 |
| MSCI All Country World IMI | -13.3 | -10.1 | 6.5 | 9.7 |
| MSCI World ex USA | -12.8 | -14.1 | 3.1 | 6.2 |
| MSCI World ex USA Small Cap | -16.2 | -18.1 | 3.9 | 10.1 |
| MSCI World ex USA IMI Growth | -14.1 | -13.8 | 3.0 | 7.2 |
| MSCI World ex USA IMI Value | -12.5 | -15.6 | 3.5 | 6.2 |
| MSCI Emerging Markets | -7.5 | -14.6 | 9.3 | 8.0 |
| MSCI Emerging Mkts Small Cap | -7.2 | -18.6 | 3.7 | 9.9 |
| MSCI Emerging Mkts IMI Growth | -8.3 | -18.4 | 7.7 | 8.9 |
| MSCI Emerging Mkts IMI Value | -6.7 | -11.5 | 9.3 | 7.5 |
| Fixed Income Returns | ||||
| Bloomberg Barclays Glbl Agg Bond± | 1.7 | 1.8 | 2.9 | 3.4 |
| Bloomberg Barclays US Agg Bond | 1.6 | 0.0 | 2.1 | 2.5 |
| Bloomberg Barclays US Credit | 0.0 | -2.1 | 3.2 | 3.2 |
| Bloomberg Barclays US Gov’t Bond | 2.5 | 0.9 | 1.4 | 2.0 |
| Bloomberg Barclays Muni Bond | 1.7 | 1.3 | 2.3 | 3.8 |
| ICE BofAML 3mos US Treasury Bill | 0.6 | 1.9 | 1.0 | 0.6 |
| REIT and Commodity Returns | ||||
| Dow Jones US Select REIT | -6.6 | -4.2 | 2.0 | 12.1 |
| S&P Global ex US REIT (net div.) | -4.7 | -7.4 | 3.4 | 8.9 |
| Bloomberg Commodity Total Return | -9.4 | -11.3 | 0.3 | -3.8 |
*Annualized, ± Hedged to USD
Past performance is not a guarantee of future results. In US Dollars. Indices are not available for direct investment. Performance does not reflect the expenses associated with management of an actual portfolio.
Figure 5: Major World Indices Ranked (1/1/18- 12/31/18)

*Hedged to USD
Past performance is not a guarantee of future results. In US Dollars. Indices are not available for direct investment. Performance does not reflect the expenses associated with management of an actual portfolio.
Broad Market Index Performance
In 2018, the MSCI Emerging Markets Value Index (IMI) outperformed its growth counterpart (–11.5% vs. –18.4%). In developed markets, however, this was not the case. The Russell 3000 Value Index underperformed the Russell 3000 Growth Index (–8.6% vs. –2.1%) and the MSCI World ex USA Value Index (IMI) underperformed its growth index counterpart (-15.6% vs. –13.8%). Small cap stocks generally underperformed large cap stocks globally. For example, the Russell 2000 Index returned –11.0% relative to –4.8% for the Russell 1000 Index. Similarly, the MSCI World ex USA Index outperformed its small cap counterpart (–14.1% vs. –18.1%), and the MSCI Emerging Markets Index outperformed its small cap counterpart (–14.6% vs. –18.6%).
The mix of relative performance of value vs. growth stocks within and across regions this year serves as a reminder of the importance of integrating premiums when designing and managing portfolios. Within US equity markets, when at least one of the size, value, and profitability premiums has been negative in a given year, at least one of the other factors was positive 81% of the time.[4] Positive premiums can contribute to relative returns during time periods when other premiums are negative.
US Market
In the US, small cap stocks underperformed large cap stocks, and value stocks underperformed growth stocks using Russell indices. The Russell 2000 Index declined –11.0% for the year vs. –4.8% for the Russell 1000. The Russell 3000 Value Index returned -8.6% in 2018 vs. –2.1% for the Russell 3000 Growth Index. The variation in returns between these indices is within historical norms. Since 1979, there has been an annual return difference of 6% or greater 60% of the time.
Developed ex US Markets
In developed ex US markets, small cap stocks underperformed large cap stocks and value stocks underperformed growth stocks. Despite underperformance in 2018, over both five- and 10-year periods, small cap stocks, as measured by the MSCI World ex USA Small Cap Index, have outperformed large caps, as measured by the MSCI World ex USA Index. Growth stocks, as measured by MSCI World ex USA Growth Index (IMI), returned –13.8%, outperforming value stocks, which returned –15.6% in 2018, as measured using the MSCI World ex USA Value Index (IMI).
Emerging Markets
In emerging markets, small cap stocks, as measured by the MSCI Emerging Markets Small Cap Index, underperformed large cap stocks, as measured by the MSCI Emerging Markets Index. However, over the past 10 years, small caps returned an annualized 9.9%, outperforming large caps, which returned 8.0%.
Value stocks returned –11.5% as measured by the MSCI Emerging Markets Value Index (IMI), outperforming growth stocks, which returned –18.4% using the MSCI Emerging Markets Growth Index (IMI). This was the sixth largest outperformance of value over growth in emerging markets since 1999.
The complementary behavior of size (small vs. large) and relative price (value vs. growth) in emerging markets in 2018 is a good example of the benefits of diversification. While small cap stocks underperformed, diversified portfolios were buoyed by outperformance among value stocks. This integration can increase the reliability of outperformance and mitigate the impact of an individual asset group’s underperformance.
Despite recent years’ headwinds, the size, value, and profitability premiums remain persistent over the long term and around the globe. It is well documented that stocks with higher expected return potential, such as small cap and value stocks, do not realize outperformance every year. Maintaining discipline to these parts of the market is the key to effectively pursuing the long-term returns associated with size, value, and profitability.
Fixed Income
Over the full year, the return on the US fixed income market was relatively flat; the Bloomberg Barclays US Aggregate Bond Index returned 0.0%. Non-US fixed income markets posted positive returns in 2018, contributing to the return of the Bloomberg Barclays Global Aggregate Bond Index (hedged to USD) at 1.8%.
Yield curves were upwardly sloped in many developed markets for the year, indicating positive expected term premiums. Realized term premiums were negative in the US as long-term maturities underperformed their shorter-term counterparts and positive in developed markets outside the US. For example, the FTSE Non-USD World Government Bond Index 10+ (hedged to USD) returned 4.4% for the year vs. 3.0% for the 1-10 Index.
Credit spreads, which are the difference between yields on lower quality and higher quality fixed income securities, widened during the year, as measured by the Bloomberg Barclays Global Aggregate Corporate Option Adjusted Spread. Realized credit premiums were negative both globally and in the US, as lower-quality investment-grade corporates underperformed their higher-quality investment-grade counterparts. Treasuries were the best performing sector globally, returning 2.8%, while corporate bonds returned –1.0%, as reflected in the Bloomberg Barclays Global Aggregate Bond Index (hedged to USD).
In the US, the yield curve flattened as interest rates increased more on the short end of the yield curve relative to the long end. The yield on the 3-month US Treasury bill increased 1.06% to end the year at 2.45%. The yield on the 2-year US Treasury note increased 0.59% to 2.48%.[5] The yield on the 10-year US Treasury note increased 0.29% during the year to end at 2.69%. The yield on the 30-year US Treasury bond increased 0.28% to end the year at 3.02%.
In other major markets, interest rates decreased in Germany and Japan, while they increased in the United Kingdom. Yields on Japanese and German government bonds with maturities as long as 10 years finished the year in negative territory.
Conclusion
2018 included numerous examples of the difficulty of predicting the performance of markets, the importance of diversification, and the need to maintain discipline if investors want to effectively pursue the long-term returns the capital markets offer. While negative years can be unpleasant, particularly when the selloff occurs in the rapid fashion experienced in the last three months of 2018, this level of market volatility is perfectly normal.
The performance of global stock markets was well within expected statistical ranges of return, and did not signify anything particularly unusual in a historical context. Additionally, when stock performance was negative, the returns on high quality bonds were positive, helping to offset the volatility of equity markets, which is the expectation in a diversified portfolio. As always, we encourage investors to ignore short-term noise and emotions that volatile markets can cause, and to stick to their long-term strategy, as history shows that this is the best way to achieve financial success.
This newsletter is distributed for informational purposes only and nothing herein constitutes an offer to sell or a solicitation of an offer to buy any security and nothing herein should be construed as such. All investment strategies and investments involve risk of loss, including the possible loss of all amounts invested, and nothing herein should be construed as a guarantee of any specific outcome or profit. While we have gathered the information presented herein from sources that we believe to be reliable, we cannot guarantee the accuracy or completeness of the information presented and the information presented should not be relied upon as such. Any opinions expressed herein are our opinions and are current only as of the date of distribution are subject to change without notice. We disclaim any obligation to provide revised opinions in the event of changed circumstances.
Please remember that past performance may not be indicative of future results. Different types of investments involve varying degrees of risk, and there can be no assurance that the future performance of any specific investment or investment made reference to directly or indirectly in this newsletter will be profitable, equal any corresponding indicated historical performance level(s), be suitable for your portfolio or individual situation, or prove successful.
A copy of our current written disclosure statement discussing our advisory services and fees continues to remain available upon request.
[1] Declines are defined as points in time, measured monthly, when the market’s return since the prior market maximum has declined by at least 10%. Declines after December 2017 are not included, but subsequent 12-month returns can include 2018 returns. Compound returns are computed for the 12 months after each decline observed and averaged across all declines for the cutoff. US markets (1926–2018) are represented by the S&P 500 and Developed ex US markets (1970–2018) are represented by the MSCI World ex USA Index.
[2] OECD Real GDP Forecast, 2019. Accessed Jan. 4, 2019. https://data.oecd.org/gdp/real-gdp-forecast.htm#indicator-chart
[3] Source: MSCI country investable market indices (net dividends) for each country listed. Does not include Greece, which MSCI classified as a developed market prior to November 2013. Additional countries excluded due to data availability or due to downgrades by MSCI from emerging to frontier market. MSCI data © MSCI 2019, all rights reserved. Past performance is no guarantee of future results. Indices are not available for direct investment; therefore, their performance does not reflect the expenses associated with the management of an actual portfolio.
[4] Measured from 1964 through 2017. In US dollars. Size premium: Dimensional International Small Cap Index minus the MSCI World ex USA Index (gross dividends). Relative price premium: Fama/French International Value Index minus the Fama/French International Growth Index. Profitability premium computed by Dimensional using Bloomberg data: Dimensional International High Profitability Index minus the Dimensional International Low Profitability Index. Profitability is measured as operating income before depreciation and amortization minus interest expense, scaled by book. Dimensional indices use Bloomberg data. Fama/French indices provided by Ken French. MSCI data copyright MSCI 2019, all rights reserved. The information shown here is derived from such indices. Index descriptions available upon request. Eugene Fama and Ken French are members of the Board of Directors of the general partner of, and provide consulting services to, Dimensional Fund Advisors LP. Indices are not available for direct investment. Their performance does not reflect the expenses associated with the management of an actual portfolio. Past performance is no guarantee of future results.
[5] Source: The US Department of the Treasury